 Signal Monitor Probe
Overview
Click on any connector to view the signal values through that connector.Open from main menu: View -> Signal Monitor...
Open by shortcut key: F10
Open by clicking a connector
Open by context menu: Signal monitor...
See also: "Tool windows in the designer".
The Signal monitor also displays the data type of the connection, the sample frequency and the running time.
Note that not all data types can be viewed through the Signal monitor.
User Interface
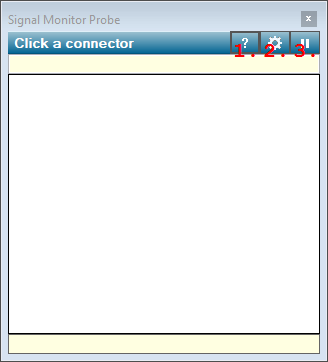
1. Open Help
Opens the Polybench help for the Signal Monitor Probe.2. Open Properties
Opens the properties dialog for the Signal Monitor.3. Pause - Continue
Pauses the signal monitor display, or continues displaying signal values. This allows you to inspect the current monitor display, before new values are written over it.
Details
The Signal Monitor, or Probe has its own update frequency. At each update, the current sample in the connection that is monitored will be displayed. As a result, you cannot see any signal changes in between updates.If you want to inspect a set of values before it is overwritten by the next sample, then you may press the Pause button on the right top of the dialog. If you press the button once more, the signal monitor continues displaying new values.
Monitor display columns
Note that you can resize the column widths of each column, so that it best suits your needs.1. Channel number
The first column show the channel number (starting from 1).
2. Channel name
The second column shows the name of each monitored channel. This is the technical name, which may be different from channel names as displayed in viewers.
3. Current value
The values that are displayed in the third column of the probe display, which are the current sample values, are truncated to 3 decimals. If the actual value contains more decimals, the value shows ".." behind the digits, to indicate that the value was truncated.
If currently no signal is available, then a "-" symbol is displayed.
4. Channel units
The fourth column shows the unit of each channel, if that applies to the channel. If no unit has been defined for a channel, nothing is displayed.
5. Channel identifiers
The fifth column is hidden by default. If you resize the monitor display and make it wider, then this column becomes visible. It contains ID numbers for each channel. This is technical information, which allows you to check if all channel are unique.
Doubled channels are purple
The Signal Monitor Probe shows which channels come from the same source channel. In that case, the Channel Identifier (see fifth column) of those channels is equal. Those channels are displayed in a purple color.If the channels have the same ID number, then those channels are copied from the same source channel. This affects channel settings of viewers, because those settings are linked to the ID numbers. If you see purple channels, then please make sure that it was your intension to have the same channel multiple times in a channel bus.
Settings per signal stream type
Different signal stream types may have different display settings for the Signal Monitor Probe. For example, some signal streams just show numerical values per channel, not requiring much space, whereas other signal streams display graphs, requiring more height per item.The properties that you set during probing one signal stream type, will only be used for that stream type.