
This viewer plots samples in along an X and Y axis in color that can be determined by a third signal. The X-Y Plotter has three inputs, one to control the X-coordinate, one to control the Y-coordinate, and one to control the pen, which can be switched on or of, or change color.
Symbol in the Object Toolbox
Operator ports
Input X: Floating point valuesInput Y: Floating point values
Input Pen: Specific sample type, see below.
Paired User Interface Object
This operator is loaded simultaneously with a user interface object. The user interface object can be moved to another page, and would normally be displayed in the end-user application. The operator and this user interface object can never be separated. If you delete the operator, the user interface is deleted automatically as well. Note that you cannot delete the user interface, only the operator symbol!To be able to use the X-Y Plotter, a number of other operators will be required to prepare signals before they are plotted. First of all, Prepare Viewer operators ("Viewer Channel Configuration (Preparation operators) Overview") are required to set the range and offset and other channel characteristics, both in X- as well as Y-direction. Without properly set ranges and offsets, your signals might plot outside the view pane and you will see nothing.
Secondly, to control the pen you will need a Signal-to-Color operator ("Signal To Color"), because the Pen input of the X-Y Plotter is of type Color. This means, you cannot connect a floating point signal to that input directly. The Signal-to-Color operator requires the signal to be in a range between 0 and 1. If your pen signal has values above 1 or below 0, you might want to use the the Normalizer operator ("Normalizer") to correct the signal. The Signal-to-Color also helps to switch the plotter pen on or off, by setting signal events as specified in the Signal-to-Color properties. See this operator for more information.
Special operations using data events
'erase' eventThe view pane of the X-Y Plotter can be erased on an exact moment in time by using a data event on the Pen input. The X-Y Plotter filters events with the event code erase, and if it encounters this event, the view pane is erased exactly from the moment this sample came in.
A less precise erase method is available as the Erase function. This also erases the plot, but the timing of erasing is not very precise. It might take a few samples before the plot is actually emptied. The Erase function has the extra option to erase only one channel in the plot.
'pause' event
If the X-Y Plotter catches a data event with the event code pause on the Pen input, then on that moment the plotting is paused. Only the drawing of the plot is then stopped; any signals that come in are buffered in the mean time, until the plotting continues.
To continue the plotting after a pause event, call the Continue function (using a FUNCTION action).
Pausing the plot is used to mark a complete loop, or to take a snap shot of the plot during data processing using the SNAPSHOT action ("SNAPSHOT"). See the example that demonstrates the pause event.
Plotting multiple channels
It is possible to have more than one channel in the input buses. It is important to note that all three inputs require the same number of input channels! If that is not true, the operator symbol will be colored red to indicate an error. In that case, drawing and scaling will not function.Using Preparation operators that are connected immediately before the inputs, a number of properties for each channel can be set. Settings that are applied to the X input are used if those settings are independent of X or Y axis, and that at the Y input are ignored in that case. Settings like ranges and offsets are bound to one axis only, so they have to be set for both axes separately.
Typical set-up
The following figure shows a typical set-up to have full control of the X-Y Plotter: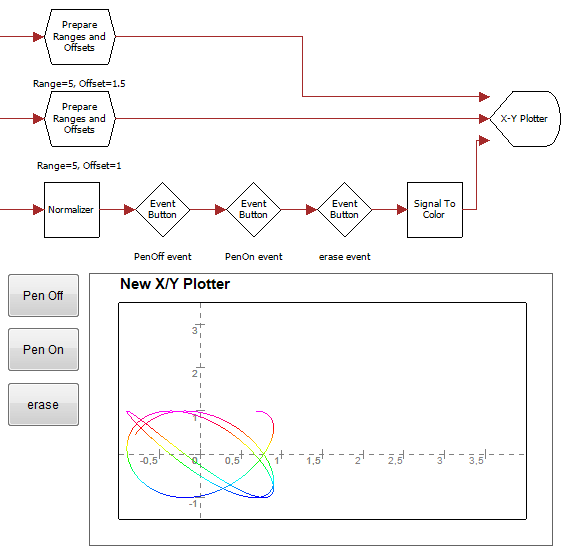
The X-Y Plotter shows X and Y axes and draws a number of ticks on the axes, including coordinate values. In the properties of the operator you can specify how many ticks should be plotted on the X and Y axis. To shift the axes in X or Y direction, specify other values for range and offset in the Viewer Preparation operators at the X and Y inputs.
The next figure shows a small application of the X-Y plotter. This application is also included as example.
User Interface Object on Printable Pages
The user interface of this component will be printed on a report, if it is put on a Printable Page (see "Page").Properties
Find more information about changing properties here: "Properties Viewer"YLabel
type: See descriptionText along the Y-axis
XLabel
type: See descriptionText along the X-axis
TicksCountX
type: Integer valueNumber of grid ticks on the X axis
TicksCountY
type: Integer valueNumber of grid ticks on the Y axis
History buffer size
type: Integer valueMax. number of seconds that samples should be buffered, in order to change, measure and redraw parts of the curve in history. Note that buffering may cost a lot of memory!
LeftPaneWidth
type: Integer valueWidth of the left area, measured in pixels when the page is zoomed at 100%.
RightPaneWidth
type: Integer valueWidth of the right area, measured in pixels when the page is zoomed at 100%.
TitlePaneHeight
type: Integer valueHeight of the title area, measured in pixels when the page is zoomed at 100%. Set to 0 zero to hide the title.
BottomPaneHeight
type: Integer valueHeight of the bottom area, measured in pixels when the page is zoomed at 100%.
ForegroundColor
type: Known color nameColor of foreground items (general texts and lines), which is a color from the color repository.
BackgroundColor
type: Known color nameColor of the background, which is a color from the color repository.
GridColor
type: Known color nameColor of the grid, which is a color from the color repository.
BackgroundImage
type: Known image nameThe name of the background image. The image name can be selected from the Image Repository (press the small button). Keep empty to have no background image.
ImageKeepAspectRatio
type: True or FalseSet to True if the background image should keep its aspect ratio. The image will then be centered.
True or False
True may also be read like 'yes' and false like 'no'
BorderStyleInside
type: See descriptionBorder style from the border repository to define the signal pane border. Leave empty to have no border.
BorderStyleOutside
type: See descriptionBorder style from the border repository to define the outer border. Leave empty to have no border.
NumberFormat
type: See descriptionNumber format name from the number format repository. This number format is used to display all values of this object. Example: '.3' three digits after dot-separator
FontTitle
type: Known text font nameThe text font of the title (select from the Font repository).
FontMetaData
type: Known text font nameThe text font of all meta data, such as channel names (select from the Font repository).
FontContents
type: Known text font nameThe text font of values and labels of the shown contents or graph (select from the Font repository).
Title
type: See descriptionThe title above the signal pane. You may use variables in the text. (Note: this is not the Caption of the operator symbol!)
One example of use is to display the name of the file that is currently viewed in the viewer. Your title then may look like this:
Viewing file $Design.File Replay.Caption$ (date: $Design.File Replay.FileDate$
Caption
type: Word or phraseThe name of the object in the project. This name must not contain '.', '$' nor '@' characters.
Documentation
type: See descriptionOptional documentation of this object. If this object is an operator, the Documentation text is displayed below the operator symbol.
Functions
Find more information about Functions here: "Operator Functions"AutoScale XY
Changes the range and offset of the graph such, that the complete curves are visible. X and Y directions are scaled proportionally, so that the aspect ratio of the plot does not change. This only works if the History buffer size is large enough!AutoScale X
Changes the range and offset along the X-axis of the graph such, that the complete curves are visible. This only works if the History buffer size is large enough!AutoScale Y
Changes the range and offset along the Y-axis of the graph such, that the complete curves are visible. This only works if the History buffer size is large enough!Erase
Erases the plot, or one channel in the plot. Note that the timing of this erase is not as precize as erasing the plot using the Erase event in the Pen signal.Optionally specify the channel number that should be erased (1..N). If the History buffer size is large, this operation may be slow, because the plot is redrawn after one channel has been erased.
Continue
If plotting is paused, because in the Pen signal a 'pause' event was detected, then calling this function lets the plotting continue.Examples
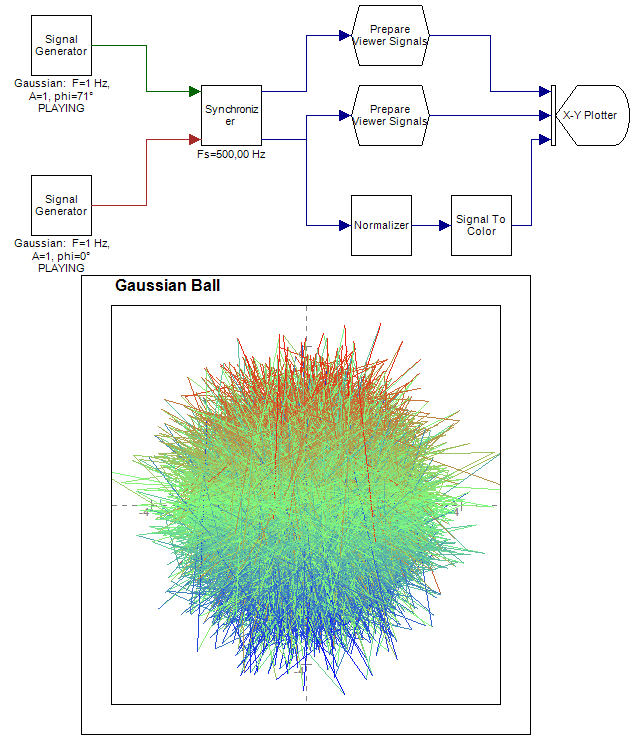
Example: Gaussian Ball X-Y Plotter Demo
Demonstrates the X-Y Plotter. Two signal generators both generate gaussian noise. After synchronization, which is always required if you are using multiple signal sources, both noise signals are fed into the X and Y inputs of the X-Y Plotter. The Prepare Viewer SIgnal operators are used to set the signal range in the X-Y Plotter.The second signal is also used to make a pen color. The Signal To Color requires a signal that has a range between 0 and 1. Because the noise signal is ranges from approx. -5 to +5, a Normalizer is used to scale the signal. The Normalizer brings the signal range and offset to be between 0 and 1 at its output.
Examples\DF0409113_001_XY_Plot_Gaussian_Ball.xmc
Example: XY Plotter Pause Demo
Demonstrates the 'pause' event. This event should be used if you want the plot to stand still for a while, although data processing continues. In this example, we want to make a snap shot (make a copy in an image) of the running plotter at a precisely defined moment. After that, we want to erase the plot, to draw the next loop. Without the 'pause' event that is difficult, because the SNAPSHOT action does not come synchronized with data processing. Therefore we have to stop the plot shortly, and then take a snap shot, erase the plot, and continue. We do that in an Action Sequence. To continue after a pause, the Continue function is called.Examples\DF0409113_002_X-Y_Plotter_Pause_Demo.xmc