 Y-T Viewer
Overview
The Y-T Viewer is a signal viewer that displays sample values against time. This viewer is optimized to display sample values in real-time, for small but also very large time ranges. The component offers a large number of properties to change its appearance and behavior.Operator ports
Input S: Floating point valuesProperties
Find more information about changing properties here: "Properties Viewer"History buffer size
type: See descriptionMaximal time in seconds that samples should be buffered, in order to change signals in history. Note that buffering may cost a lot of memory! Buffer times below 5 seconds will be reset to 0.
Scroll mode
type: True or FalseSet to true if the viewer should scroll all signals, or to false if the viewer should show a moving cursor.
Select one of those presets:
True or False
True may also be read like 'yes' and false like 'no'
True or False
True may also be read like 'yes' and false like 'no'
CursorWidth
type: Integer valueThe width of the drawing cursor. This value must be greater than or equal to 0. By default it is 10.
CursorImage
type: Known image nameAn image that forms the drawing cursor. By default no image is drawn. The image will be stretched so that it fits the set cursor width.
This property uses the Image Repository. For more information about the use of images in a project, refer to "Image Repository"
BackgroundColor
type: Known color nameThe color of the background.
This property uses the Color Repository. For more information about the use of colors in a project, refer to "Color Repository"
ForegroundColor
type: Known color nameThe color of the title, axes and other lines around the graph.
This property uses the Color Repository. For more information about the use of colors in a project, refer to "Color Repository"
GridColor
type: Known color nameThe color of the grid or markings.
This property uses the Color Repository. For more information about the use of colors in a project, refer to "Color Repository"
SelectionColor
type: Known color nameThe color for channel selections.
This property uses the Color Repository. For more information about the use of colors in a project, refer to "Color Repository"
BorderStyleOutside
type: See descriptionSelect a style for the outer border of the viewer.
BorderStyleInside
type: See descriptionSelect a style for the border of the panel where the viewer contents or graph is drawn.
Title
type: See descriptionThe title above the graph. You may use variables in the text.
Variables that are used as part of the viewer title are only updated if the viewer itself is updated, so you cannot for example display a clock as title.
One example of use is to display the name of the file that is currently viewed in the viewer. Your title then may look like this:
Viewing file $Design.File Replay.Caption$ (date: $Design.File Replay.FileDate$
One example of use is to display the name of the file that is currently viewed in the viewer. Your title then may look like this:
Viewing file $Design.File Replay.Caption$ (date: $Design.File Replay.FileDate$
Y_Label
type: See descriptionThe label along the Y-axis.
Y_LabelVisible
type: True or FalseSet to False to disable the label along the Y-axis
Select one of those presets:
True or False
True may also be read like 'yes' and false like 'no'
True or False
True may also be read like 'yes' and false like 'no'
X_Label
type: See description [this value cannot be changed]The label along the X-axis.
X_LabelVisible
type: True or FalseSet to False to disable the label along the X-axis
Select one of those presets:
True or False
True may also be read like 'yes' and false like 'no'
True or False
True may also be read like 'yes' and false like 'no'
FontTitle
type: Known text font nameThe text font of the title (select from the Font repository).
This property uses the Font Repository. For more information about the use of text fonts in a project, refer to "Font Repository"
FontMetaData
type: Known text font nameThe text font of all meta data, such as channel names (select from the Font repository).
This property uses the Font Repository. For more information about the use of text fonts in a project, refer to "Font Repository"
FontContents
type: Known text font nameThe text font of values and labels of the shown contents or graph (select from the Font repository).
This property uses the Font Repository. For more information about the use of text fonts in a project, refer to "Font Repository"
SingleBaseline
type: True or FalseSet this value to 'true' if you want all the signals to be drawn around one baseline.
Select one of those presets:
True or False
True may also be read like 'yes' and false like 'no'
True or False
True may also be read like 'yes' and false like 'no'
ExtraRoomTopBottom
type: True or FalseIf true, a full baseline distance is added above the first channel and below the last; if false only half a baseline distance is added. If only one channel is visible, this setting may influence your Range/Offset settings.
Select one of those presets:
True or False
True may also be read like 'yes' and false like 'no'
True or False
True may also be read like 'yes' and false like 'no'
AllowChannelSelect
type: True or FalseIf true, the user is able to select channels by clicking one or more channel names.
Select one of those presets:
True or False
True may also be read like 'yes' and false like 'no'
True or False
True may also be read like 'yes' and false like 'no'
AllowZooming
type: True or FalseSet to true if the end-user is allowed to change the time range from within the viewer, by scrolling the scroll wheel of the mouse.
Select one of those presets:
True or False
True may also be read like 'yes' and false like 'no'
True or False
True may also be read like 'yes' and false like 'no'
NumberFormat
type: See descriptionDetermines how values are displayed in the viewer. Examples: ',2' (decimal comma), '.3' (decimal dot), ';1' (decimal comma or dot). This only regulates sample values, not time labels.
For more information about Number Formats, please refer to "Number format codes".
ClockTime
type: True or FalseDetermines if times are displayed as a continuous time (set to false), or as clock time (set to true). Clock time makes the time always be between 12 or 24 hours (depending on your culture).
Select one of those presets:
True or False
True may also be read like 'yes' and false like 'no'
True or False
True may also be read like 'yes' and false like 'no'
In Clock Time mode, the viewer assumes the sample time to be a time in one day. The sample with t=0 is then considered to occur at midnight.
After 24 hours worth of samples, the time will change from 24:00:00 to 0:00:00 (or 12:00:00 AM, or similar).
The time that is displayed is formatted according to the cultural settings of your operating system.
After 24 hours worth of samples, the time will change from 24:00:00 to 0:00:00 (or 12:00:00 AM, or similar).
The time that is displayed is formatted according to the cultural settings of your operating system.
BackgroundImage
type: Known image nameThe name of the background image. The image name can be selected from the Image Repository (press the small button).
This property uses the Image Repository. For more information about the use of images in a project, refer to "Image Repository"
Caption
type: Word or phraseThe name of the object in the project. This name must not contain '.', '$' nor '@' characters.
For more information about the rules and usage of the Caption property, please refer to "Caption property - background and usage".
Documentation
type: See descriptionOptional documentation of this object. If this object is an operator, the Documentation text is displayed below the operator symbol.
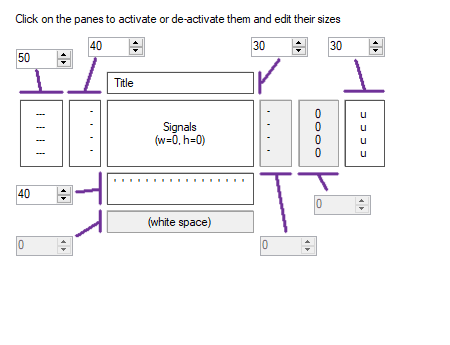
Extra dialog to change properties of this object: Layout
Variable Parameters
Find more information about Variable Parameters here: "Variable Parameters"ImageName
type: See descriptionThe name of the background image, which is an image in the Image Repository
TimeLabelOffset
type: See descriptionThe time offset of the time labels in the viewer. Setting this value will change the time that is displayed for the current signals. The time is expressed in hour:minute:second, or in seconds.
ClockTime
type: See descriptionDetermines if times are displayed as a continuous time (set to 1), or as clock time (set to 0). Clock time makes the time always be between 12 or 24 hours (depending on your culture).
In Clock Time mode, the viewer assumes the sample time to be a time in one day. The sample with t=0 is then considered to occur at midnight.
After 24 hours worth of samples, the time will change from 24:00:00 to 0:00:00 (or 12:00:00 AM, or similar).
The time that is displayed is formatted according to the cultural settings of your operating system.
After 24 hours worth of samples, the time will change from 24:00:00 to 0:00:00 (or 12:00:00 AM, or similar).
The time that is displayed is formatted according to the cultural settings of your operating system.
Functions
Find more information about Functions here: "Operator Functions"AutoScale
Changes the range and offset of all (or selected) channels in a way, that all signals in the current view are entirely visible. There must be a preparation operator before the viewer operator that set the ranges and offsets, e.g. the Prepare Ranges and Offsets ("Prepare Ranges and Offsets").Parameter:
Optional wildcard filter ("Filter items with wildcards"), or set notation ("Set algebra parser"), to specify specific channels. It is also possible to select the alternative (technical) name by writing '/' before the name selector, for example /*BIP.
Optional wildcard filter ("Filter items with wildcards"), or set notation ("Set algebra parser"), to specify specific channels. It is also possible to select the alternative (technical) name by writing '/' before the name selector, for example /*BIP.
AutoRange
Changes the range of all (or selected) channels in a way, that the signals in the current view are entirely visible, without changing the offset. There must be a preparation operator before the viewer operator that set the ranges and offsets, e.g. the Prepare Ranges and Offsets ("Prepare Ranges and Offsets").Parameter:
Optional wildcard filter ("Filter items with wildcards"), or set notation ("Set algebra parser"), to specify specific channels. It is also possible to select the alternative (technical) name by writing '/' before the name selector, for example /*BIP.
Optional wildcard filter ("Filter items with wildcards"), or set notation ("Set algebra parser"), to specify specific channels. It is also possible to select the alternative (technical) name by writing '/' before the name selector, for example /*BIP.
AutoOffset
Changes the offset of all (or selected) channels in a way, that the signals in the current view are evenly spread in the view, without changing the range. There must be a preparation operator before the viewer operator that set the ranges and offsets, e.g. the Prepare Ranges and Offsets ("Prepare Ranges and Offsets").Parameter:
Optional wildcard filter ("Filter items with wildcards"), or set notation ("Set algebra parser"), to specify specific channels. It is also possible to select the alternative (technical) name by writing '/' before the name selector, for example /*BIP.
Optional wildcard filter ("Filter items with wildcards"), or set notation ("Set algebra parser"), to specify specific channels. It is also possible to select the alternative (technical) name by writing '/' before the name selector, for example /*BIP.
Erase
Erases the signal pane and sets the cursor to the left border.
Details
Changing signal properties
The Y-T Viewer only offers settings for the viewer in general. You cannot set any properties for the different signal channels that the viewer displays. If you want to change any properties of one or more signal channels, you need preparation operators that are connected just before the Y-T Viewer. For more information, please refer to the section about preparation operators ("Viewer Channel Configuration (Preparation operators) Overview").No data review
Note that this viewer does not allow the user to scroll back to previously measured data. To re-view data, use the Y-T Reviewer ("Y-T Reviewer"). The reason for this is that the Y-T Viewer does not have access to stored signal data.Because the Y-T Viewer only draws signals on the time the signals come into the Y-T Viewer, re-drawing the signals would not be possible. But sometimes the user whishes to change the time range of the viewer, add or remove channels, or change for example the color of a signal channel. In those cases, the user expects the signals to be redrawn using the new settings.
This is only possible if the Y-T Viewer remembers the signals that it needs to redraw. The question is only how long back in time?
This issue is solved by using the property History buffer size. In this property you determine how long back in time signals can be redrawn. If you define that a Y-T Viewer shows signals over a time range of less than one minute, then you need a history buffer size of 60 seconds.
If you then show a larger time range, signals are not any longer redrawn if a channel property changes.
User Interface Object on Printable Pages
The user interface of this component will be printed on a report, if it is put on a Printable Page (see "Page").Examples
Example: Y-T Viewer Background Image Parameter Demo
Shows that the background image of a Y-T Viewer can be changed on the fly.Examples\DF0305009_001_Y-TViewer_Background_Image_Demo.xmc
Example: Viewers Tutorial
Small tutorial that shows various aspects of Y-T Viewers (for live data viewing), and also how to use the various Viewer Preparation Operators.Examples\DF0305009_003_Y-TViewers_Tutorial.xmc
Example: AutoScale, Auto Range and AutoOffset Demo
This demo shows the difference between the AutoScale, AutoRange and AutoOffset functions of Y-T Viewers. Those three functions are related, but either of them will make sense for specific signal views, with specific time ranges, and user requirements.For example, viewer 1 at 35 sec time range will profit most from the AutoScale. Viewer 3 at 5 sec time range could very well use AutoOffset, to let the view move along with the signal. Viewer 2 at 5 sec time range changes its amplitute and could profit from AutoRange. Which of the functions is the right one, also strongly depends on user requirements.
Just try out the possibilities in this demo!
Examples\DF0305009_004_AutoScale_AutoRange_AutoOffset_Demo.xmc