 Design Window
Overview
The main window of Polybench Designer contains a project editor and a number of functions that help you design analysis programs.User Interface
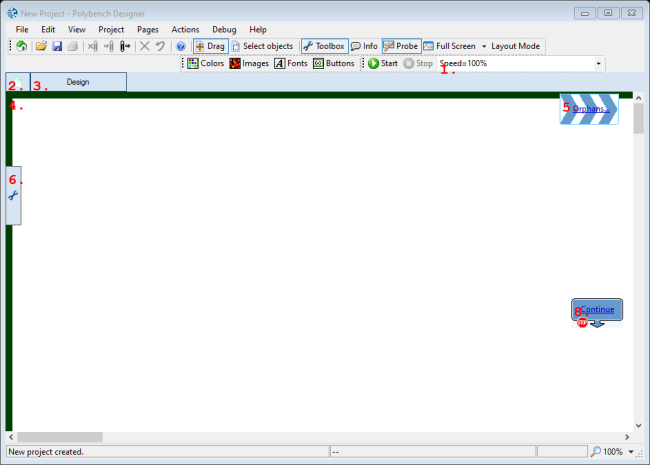
1. Play speed selection box
Select the replay speed. A speed of 100% is real-time speed. If you change the selection in this box, then this is equal to issueing a SPEED action ("SPEED"). Read more about play speeds here: "Play Speed".2. Add New Page button
Press this button to add a page to the project. This will open the Page dialog ("Add a Page to the project"). For more information about the Page Bar, see "Page Bar".3. Page button
Press any of the page buttons to show the page with the name of the button. The button of the selected page is white. See also: "Page Bar".4. Drawing Board
This is the designer area, on which you design measurement configurations as well as user interfaces.5. Orphan objects available
After copying and pasting, or moving objects to another page, some objects may be automatically placed on the page. If any of such objects exist on the current page, then this item is displayed. Click it to move the view to the orphan objects.6. Open Toolbox lever
If the Object Toolbox feature of the designer (see "Object Toolbox") has been set active, then if you move your mouse over this panel, or if you click on it, then the Object Toolbox opens. You can drag the lever to another position on the left screen side.7. Look here!
If in one of the object finder dialogs an object link is clicked, then this arrow points to the left top of that object. See also "Navigation Arrow".8. Current breakpoint
If a process breakpoint has been set and the condition of the breakpoint is met, this label indicates where the process has stopped. See also "Breakpoints".
Details
The Designer main window contains five functional areas. From top to bottom:Program menus
On the top bar a number of menus are displayed. Click on them to open each of the menus. The menu items are explained later on in this manual.
Tool bars
The next area is the tool bar area, containing a number of tool bars with buttons that copy functionality from the menus. Because the tool bar buttons are always visible, they provide an easier way to apply their respective commands.
Page bar
The third area in the main window is the "Page Bar". The page bar shows a button for each page in your project. For more information on pages, see here: "Page".
Drawing Board
The largest area on the main window is the Drawing Board. Here the pages of your project are shown, and also the analysis schematics.
We have tried to keep the drawing board area as large as possible, to give as many drawing freedom as possible.
A number of tools belong to the drawing board. You can read more in the section "Tool windows in the designer".
Status bar
At the bottom of the screen, the status bar is located. On this bar designing information is displayed, as well as information about what is happening at the moment.
From the status bar you can read the coordinates of the object that is currently selected. Also, from the status bar you can change the zoom factor of the current page (that can also be done using the scroll wheel of your mouse, or the View main menu).